
Homes are selling faster than ever at higher and higher prices. Should homebuyers give up in a market this competitive?
These conditions are frustrating, but Federal Reserve Economic Data (FRED) shows that Americans are more financially prepared for homeownership than they might realize.
Here are three ways financial well-being has improved and how a payment today is cheaper than 2006.
1. Debt-to-Income Ratio is Low
Household financial obligations are expenses like auto lease payments, homeowners’ insurance, and property tax payments. Those costs are divided by disposable personal income to produce the chart below.
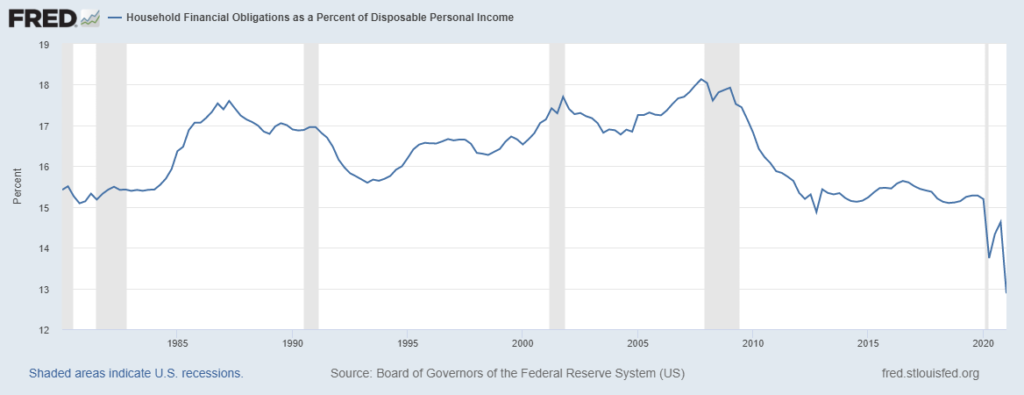
We are currently at the lowest level recorded since 1980. This is a good sign that households can pay off the debts they owe.
2. Incomes and Wages are High
FRED reports that average hourly wages have been on a steady climb. The average hourly wage was $20.32 in August 2006 and grew to $30.11 in August 2021. An increase of $10 per hour. Further data from the US Department of Housing and Urban Development shows that median incomes have increased by $20,300 from 2006 to 2021.
3. Savings are High
Higher on the graph below indicates a larger amount of savings for the average American family.
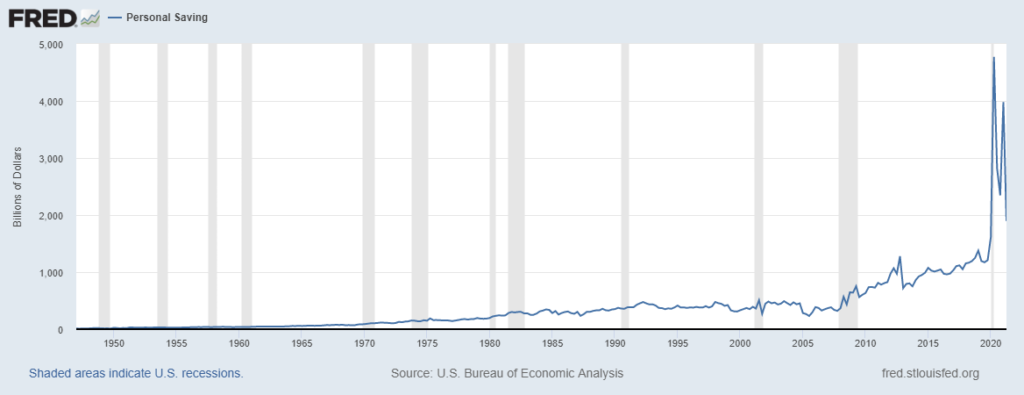
The spikes and dips this past year are a result of stimulus payments during the COVID crisis. Today’s savings are some of the best on record, even after most of the stimulus money was spent.
Payments Today Are Better Than 2006
Earnings and savings are higher, but have they kept up with monthly payments? Using our Total Cost Analysis we can directly compare the average rate and average sales price of a home in August 2006 and August 2021 to estimate a monthly cost.
Here’s the data from FRED that went into calculating the chart below:
- The average price of a home in August 2006: $317,300
- The average rate in August 2006: 6.52%
- The average price of a home in August 2021: $443,200
- The average rate in August 2021: 2.86%
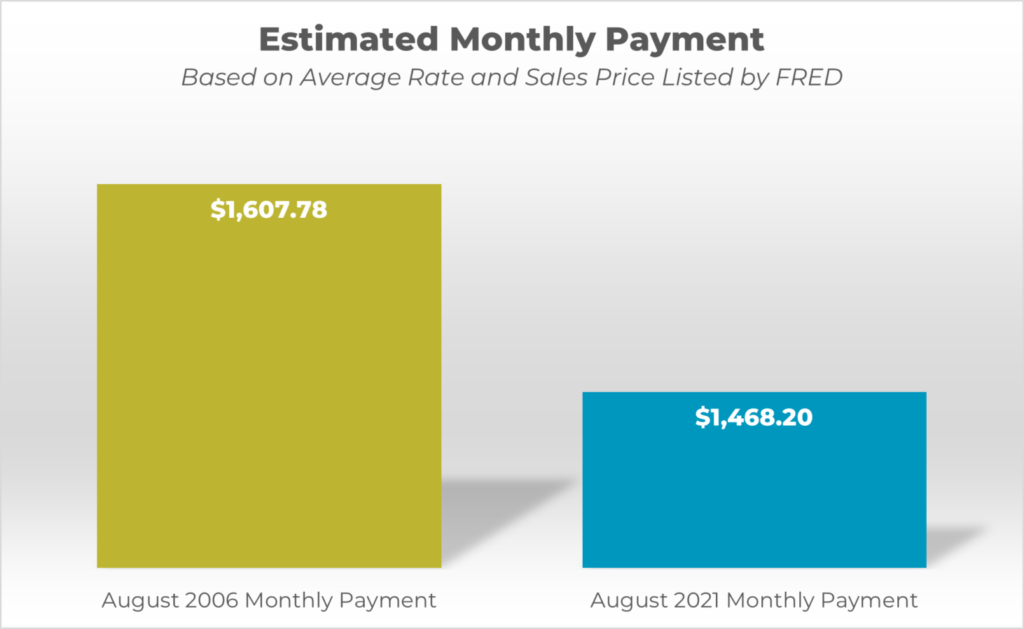
* Payment does not include property taxes, hazard insurance, or HOA. Terms are based on a 740 FICO score and 20% down assumption.
Your monthly payment today is $139.58 LESS than 15 years ago.
Higher earnings, better savings, and lower rates all add up to a much more prepared homebuyer today. A home bought in 2021 would also gain significantly more equity over the next 30 years. Equity is defined by subtracting your remaining loan balance from the property value.
Using our Total Cost Analysis tool again, we can estimate the difference in equity gain.
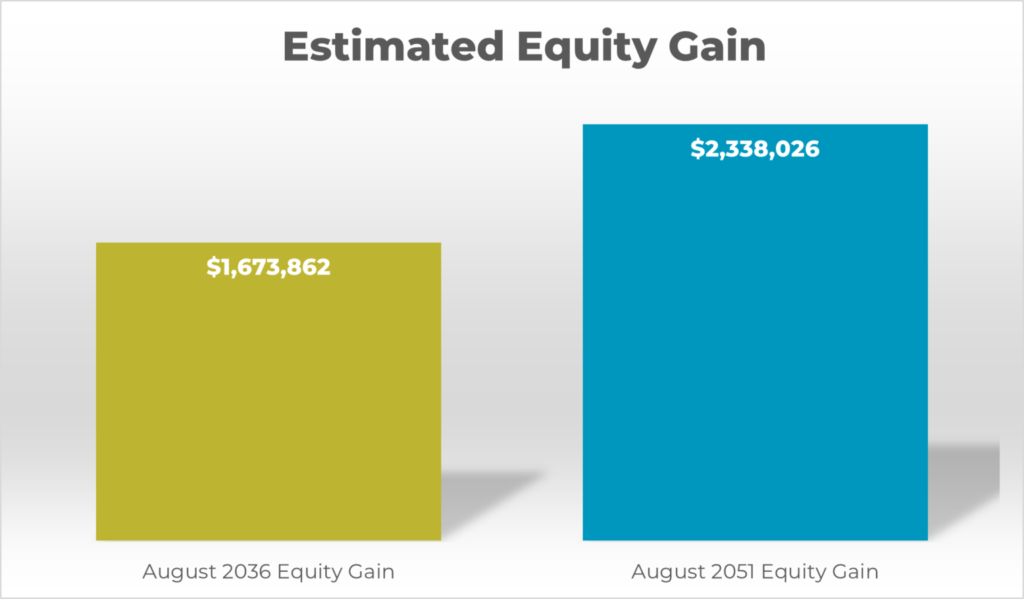
A home purchased today stands to gain over half a million dollars more in equity over the next 30 years.
Bottom Line
Keep at it! Home prices are increasing, but today’s lower rates and higher earnings show that homeownership is still possible. If you’d like to see what your home payments could be, request a consultation with one of our mortgage advisors. We can create a Total Cost Analysis for you and determine the best loan for your unique situation. This tool will also help you pay off your mortgage and consumer debts faster, all while maximizing your real estate wealth.
If you would like to learn more about Total Cost Analysis than send us an email at theinsightteam@neohomeloans.com to get started your process. We look forward to hearing from you soon!